Rumor has it that canvassing will be completed today in Wisconsin's Supreme Court election which will allow the declaration of an official winner.
From a data perspective, it's been interesting. By midnight on election day the incumbent held about a 700 vote lead with 99% of precincts reported. Although the AP wouldn't call the race, pundits said that it was very unlikely that the lead would change based on past voting patterns in the last 1%.
Did you ever hear the phrase "Past performance is no indication of future returns"? I guess someone should have reminded the pundits. By morning, the challenger turned things around and climbed to a 200+ vote lead with just a single precinct left to report.
Again, the pundits said that, based on past patterns in that precinct, the challenger's lead would be cut by about 100 votes leaving her with slightly more than a 100 vote lead, guaranteeing a recount. The last precinct didn't change the lead by more than a few votes.
In spite of the "Past performance is no indication of future returns" disclaimer, this was a statistically interesting result. Any time there is a major change in patterns, it should stand out to statisticians. That's not a statement about vote fraud. It's just a statement that a new pattern emerged.
But then things got even more interesting.
Thursday, April 14, 2011
Saturday, April 9, 2011
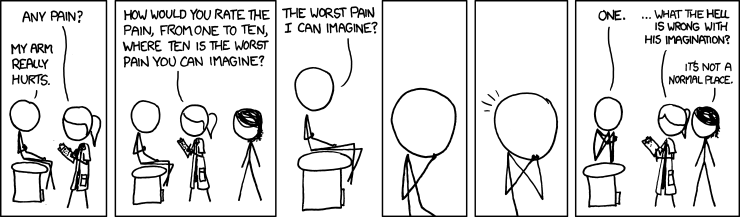
More Ordinal Scales
On an unexpected trip to the ER last week I was again asked the universal "rate your pain" medical question. It's the first time in my life I've ever answered "at least 8", but this comic still makes me laugh today:
http://imgs.xkcd.com/comics/pain_rating.png

http://imgs.xkcd.com/comics/pain_rating.png
Friday, April 1, 2011
Increase in Adoption Demand. Cleaner Babies?
The April 2011 Reader's Digest has an article on inventors and their inventions. One featured invention is a combination of a baby onesie and a dust mop. Dress your baby in this outfit, let them crawl around the floor, and cleaning takes care of itself.
Not only has the product been wildly popular with parents, it's also inspired a significant increase in applications to adoption agencies. There's been more demand than supply of adoptable babies for many years, but this new wave of applications is swamping adoption agency staffs across the nation.
We should always be wary of causality claims based on statistical association, but this one looks real. Once the Kolt Agency in Chicago noticed the increase in applications they added a survey to their adoption applications asking the applicants about their motivation to pursue adoption.
Although the entire data set has not been released yet, the response from Biff and Betty Hathaway certainly supports a causal link between baby clothing/dust mops and adoption interest: "We never wanted kids because pregnancy seemed like a hassle and we thought babies would mess up our house. But with these new baby dust mops, having a couple of kids around could actually make our house cleaner. If they won't let us adopt, maybe we'll just volunteer to babysit for some of our friends."
Wednesday, March 30, 2011
Do School Vouchers Work? Yes, No, Maybe So
There was an interesting story on the news last night and in this morning's paper. A study found that voucher students in Milwaukee test lower than non-voucher students.
Like many issues that are both statistical and political, there's a fair amount of posturing surrounding this one but let's try to focus on the data.
On this particular test, the average scores of voucher students were clearly lower than those of Milwaukee students overall. That's not open to debate. The question is, what does it mean? Voucher critics want to present this as evidence that vouchers don't work (i.e. a causal link between vouchers and performance). Voucher fans present a list of flaws in the study to refute the causal claims of the critics.
If the test scores were reversed, you'd probably read opposite comments by the same people. Voucher critics would say what was wrong with the study and voucher fans would claim the study "proves" vouchers work.
If you don't believe me, check out this article or this one. These came out today and cover different studies potentially implying that vouchers "work". The arguments aren't quite the opposite of yesterday, but they're close.
Thursday, March 24, 2011
House M.D. Tells it Like it is
House M.D., March 14th 2011 episode: Taub uncovers information implying that a patient has plans to set off bombs at school. He and Masters discuss what to do with the information. The last line says it all.
-----------------
Masters: What are you gonna do?
Taub: What do you think I should do?
Masters: So you can do the opposite? There are kids all over the country doing dumb, potentially violent things, but the percentage of them who would actually kill anybody is minuscule.
Taub: So I shouldn't do anything?
Masters: Mm... while the odds are low, the fallout could be huge. Tens or even hundreds of lives.
Taub: So I should call the cops.
Masters: Of course, over-identification with the subject could skew the calculation towards being over-protective. Or, alternatively...
Taub: You suck at this.
Masters: Hate the statistics, not the statistician.
----------------
http://www.tv.com/house/bombshells/episode/1375867/trivia.html
Thursday, March 17, 2011
Will the Baby Boomers Ever Retire?
I got a copy of On Balance: The Magazine for Wisconsin CPAs in the mail today. An article on today's job market contains the following: "In three to five years, a tremendous number of professionals in accounting, financial services, and government will retire ... That's good news for job seekers ..."
Today is March 17th, 2011. The funny thing is, I've been hearing about mass retirements in the next "three to five years" since the 1990s.
I was talking to my advisor about PhD dissertation topics and suggested that I could research how firms manage the loss of institutional knowledge in the face of mass retirements. Being wiser than me, he shot the idea down. Considering that I finished my dissertation in 1995 (on a totally different topic), I clearly heard about the upcoming wave of retirements a long time ago.
Somehow though, the wave of retirements and the resulting labor shortage hasn't happened. It stays just around the corner. How is this possible? Don't they say "demographics is destiny"?
The problem isn't demographics - it's projecting future trends based on past results.
The oldest Boomers are in their mid-60's today and were in their mid-40's when I first started to hear about the upcoming retirement wave. No one actually thought that Boomers would retire in their mid-40's but they were observing the group just ahead of the Boomers.
It wasn't uncommon for high level executives to retire in their early to mid 50's. After 30+ years of 70+ hour workweeks many of them had made a lot of money and knew that they had hit their personal corporate ceiling. They were never going to be CEO. Their bodies and minds were feeling the effects of 30+ years of stress so they decided to get out and enjoy retirement while they were still able.
Similarly, many civil service employees found that, not only had they peaked in their government organizations, but they had maximized their pensions. While they didn't have the financial resources of the corporate execs, they had a solid pension with health insurance so many of them decided to retire and pursue other interests.
Therefore, it wasn't crazy to think that many of the Boomers would follow the same pattern when they hit their 50's. That wasn't very far away. By 2000, the leading edge of Boomers would be in their mid-50's. The projections seemed to make sense.
Then reality happened. Boomers are the first generation to be heavily invested in 401k retirement plans and the 1999 tech stock crash played havoc with the entire market. Some folks on the verge of retirement decided to hold off a few years to rebuild their portfolios. Based on the last 10 years of stock market performance, some are still waiting.
Another pattern occurred too. Many of the "young" retirees from the early 1990's wanted to go back to work. Perhaps they got bored playing golf after four or five years. Perhaps their investments hadn't done as well as they hoped. Perhaps it was both. Regardless, they wanted at least part of their old work lives back but they couldn't get it. Whether they had grown obsolete or it was age discrimination, most of them were not able to get the kinds of positions they wanted.
The Boomers were watching. The lesson? Be careful about walking away too early because you can't come back.
As a result, the Boomers are holding on to their jobs longer than expected. In my field, college teaching, mandatory retirement ages have largely been eliminated. The Chronicle of Higher Education frequently has articles on conflicts between those seeking college teaching positions and older professors who will not retire. It's not much different in the corporate world.
So what's going to happen? Will there be a "tremendous number" of retirements in "three to five years"? I don't know for sure, but I don't think so. Of course the Boomers will all eventually retire or die but I think they'll go by attrition rather than en masse. Most of the Boomers I know simply do not have the resources to retire any time soon. Some will be forced to retire when their health fails. Others might get a nice inheritance along the way and decide that they finally have the resources to retire. Others will work well into their 60's and even their 70's either because they have to or they just plain want to.
Note: my stories/characters (executives, civil service employees, and Boomers) are blended from multiple individuals I know. However, that makes my analysis anecdotal rather than purely data based (data is not the plural of anecdote). Where and how might you find actual data to support or refute my theory of why the wave of retirements predicted nearly 20 years ago still hasn't happened?
Wednesday, March 9, 2011
Correlation and Cause: Does Walmart make you fat?
I just learned of a study analyzing the presence of Walmarts and obesity rates.
You can download the entire paper but at least read the abstract carefully. At one point the author says one variable "explains" the other. But just before that, he says one variable "increases" the other. Claiming that one variable increases another is a much stronger claim than "explains" and largely implies "cause".
Do you think that a causal claim is appropriate? Will building more Walmarts really make people fatter or can something else explain the association?
Thursday, March 3, 2011
Social Security and You (Part 2)
I ran across an article on Social Security funding and thought it was a good time to write a follow-up to my previous post on Social Security.
I hope that some of you did the work to answer the questions in that post and that you now have an idea of how much you pay for Social Security. Whether you think that amount is a lot or a little isn't necessarily the issue. Knowing what you pay will help you evaluate statements that others make about Social Security's costs, benefits, and viability.
Those "statements that others make" include my own. Here they are...
I was in my mid-teens and working at one of my first jobs (and paying Social Security taxes) when I first read an article about Social Security going "bankrupt" in about 50 years. It didn't take great brain power to add "mid-teens" and "50 years" to determine that it would go kaput right about the time that I was supposed to start getting paid instead of paying. That struck me as kind of a raw deal.
Since then, both sides of the political aisle have tweaked Social Security at the edges and pretended that they've done something significant but the "bankrupt" year has only been pushed back about 10 years. Now it's projected that I might get as much as six years of Social Security payments before there are real problems. I guess that's an improvement, but it still seems like a raw deal considering that I will have paid into the system for over 50 years.
If you're younger than me, I believe that the deal just gets worse. However, this all sounds a lot like one guy's opinion. What about the data? I strongly suggest reading The Coming Generational Storm by Laurence J. Kotlikoff and Scott Burns. It's a well-researched, data-driven analysis of Social Security but written in a readable style.
You don't have to buy it. If your local public library doesn't have a copy, ask them to buy one. Those are your tax dollars too.
Friday, February 25, 2011
Surveys: You get what you ask for?
OK, I give in. I'm writing about the Wisconsin budget repair battle. I came across an interesting poll result that's too good to pass up.
Poll: Wisconsin Gov. Scott Walker Winning Labor, Budget Fight - Peter Roff (usnews.com)
Dick Morris, former Clinton pollster, released his finding on public opinion in Wisconsin. Read the article and decide for yourself if the headline is fair. But pay special attention to the last two paragraphs.
When people are asked if collective bargaining for teachers should be restricted to benefits and wages (as the bill would do), 54% say "no" and are opposed to that part of the bill. However, if you re-state the question and say that the collective bargaining limit "gives schools more flexibility, makes it easier to get rid of bad teachers and retain good ones..." then the poll results flip and 58% say "yes" to that part of the bill.
I applaud Morris' poll for asking the question both ways because it's a great example of how easy it is to slant poll results. Regardless of the issue, if your survey frames a "yes" with negative outcomes you'll get fewer "yes" answers. Frame it with positive outcomes and you'll get more "yes" answers.
Well duh! That should obvious. Every pollster should avoid loading their questions with positive or negative terms.
Now go read some surveys on hot-button issues. Whether intended or not, you'll find a lot a loaded questions because it can be hard to write a neutral question. Sometimes the best option is to ask the question a couple of different ways, like Morris did, to see how the outcomes change.
Tuesday, February 22, 2011
Social Security and You (Part 1)
Back in the 80's, I was a public high school teacher for a couple of years. Therefore, I find the current events in Madison WI interesting. There are a multitude of data issues behind the protests and press conferences and I've learned things about teacher pensions that I wasn't aware of.
I considered writing about teacher pensions, but decided against it because 1) most who read this post aren't teachers, and 2) things could quickly deteriorate into a non-data political discourse.
Then I saw this comic in today's paper and decided that it was a good time to bring up Social Security. While it has its own political discourse risks, I'm willing to take that chance.
The primary target audience for this entire blog is college students but this post is especially for them.
How much do you know about Social Security taxes? If you have a job, you should look at your last pay stub. There are probably a couple of lines, one for "Social Security" and another for "Medicare" (maybe something's labeled OADSI). Many people discuss Social Security and Medicare as if they are one thing, but they're technically different programs. How much does that matter from a data perspective?
Regardless of whether or not you group them together, do you know what percent of your income they take for these taxes? Are you aware of how much your employer pays in addition to your payment? When you do your tax returns (or someone does them for you) do have any idea how income tax deductions and credits do or don't relate to Social Security/Medicare taxes?
I'm not going to answer any of these questions here. If you don't know the answers I urge you to look them up. I also strongly suggest that after you do your taxes you sit down and figure out exactly how much federal income tax, state income tax, and Social Security/Medicare tax you paid as a percent of your income. You may hear a lot about marginal tax rates but you should know what percentages you actually pay. You may be surprised, pleasantly or otherwise, at your actual percentages and how those three categories (fed, state, Soc Sec) compare.
Once you've figured out what percent you pay, do you know what you're supposed to get in return? Do you know what you're actually going to get? Is that really two different questions?
I hope that I've whet your appetite enough to seek some answers. After you find those answers you can let me know if it was worth the effort.
More to come...
Friday, February 18, 2011
Ordinal scales - #$#%!
I recently had rotator cuff surgery and now I'm in physical therapy. At every session the therapist asks "how would you rate your pain today on a 10 point scale?". They tell you that 0 is "no pain" and 10 is "the worst pain you can imagine".
How am I supposed to answer this question? It always hurts. Some days only a little, some days a little more, and some days a lot. How am I supposed to tell the difference between a 3 and 4? I've never actually said anything bigger than 5. Does that mean that my 5 is really a 10 because it's the worst pain I have or is my 5 really a 5 because I can imagine much worse pain (being skinned alive, dental drilling without novacaine, etc.)
I'm not saying that there is no such thing as ordinal data. Many phenomena of interest are naturally ordinal (good, plus good, double plus good!). The problem occurs when we impose a numeral-based scale on an ordinal phenomena. People start to think that the numerals represent real numbers. Then they think it makes sense to analyze them as numbers: "The patient's average pain this week was 3.428."
Fortunately, my therapist has never made a statement like that, but course evaluations where I teach are done on numeral-based ordinal scales and every semester the institution computes means and standard deviations for teachers, classes, divisions, etc. It's statistical nonsense.
Thursday, February 17, 2011
Surveys - where do they get these people?
I've always wondered where Family Feud found people for their surveys.
Now I wonder even more.
Now I wonder even more.
Wednesday, February 16, 2011
Is college useless?
Academically Adrift was published last month. The link takes you to the U of Chicago Press but you can Google "academically adrift" and find many articles about it. (Disclaimer: I have not read the book itself and I do not get a commission if you buy it.)
A key component seems to be the authors' finding that roughly 36% of all college students fail to show improvement on a particular learning assessment, the CLA.
A key component seems to be the authors' finding that roughly 36% of all college students fail to show improvement on a particular learning assessment, the CLA.
The street-level interpretation? College doesn't work.
As expected, some in the higher education world are upset by these findings and the study has been attacked on several fronts. However, it seems to me that a key statistical understanding is missing.
For the sake of discussion, let's take the findings at face value. Let's assume that the CLA is a good test and let's assume that the data is representative of all college students.
Is the street-level interpretation fair? Maybe, maybe not.
We don't know what would have happened to a similar group of non-students. What would the CLA show for a group who entered the workforce right after high school and never attended college? If there were the same 36% - 64% split then college would make no difference in learning.
But what if the non-college split was 90% - 10%? Then the college student results would be evidence that college works well. What if the non-college split went the other way and 90% of non-college students improved? That would be evidence that college actually hurts.
Even without considering an alternate test group, it's also worth pointing out the "half empty/half full" issue. If 36% of college students show no improvement, then 64% evidently do show some improvement. If college increases scores for nearly 2/3 of students, it might not be fair to say college doesn't work.
What do you think of this study? How can the data be interpreted?
Also, is it fair for you to comment on the study based on my blog post or should you read more about Academically Adrift first? Should you read the entire book before you comment? Should I have read the entire book before writing a post? The world is full of summaries about summaries. How far back toward the original data should we have to dig before we're allowed to comment or draw conclusions?
Welcome to Data Matters
Welcome to my new blog. I've taught statistics for nearly 20 years from 100-level general education courses through applied MBA classes. In spite of my love of data and the stories that data can tell, I've learned over the years that most students don't share my devotion and many view my courses as "sadistics" instead of "statistics".
Therefore, I'm starting this blog as an out-of-class tool to engage my students in the world of data. I'll post article links, commentaries, and other data insights for them to read and perhaps comment on. If you aren't a student and you've stumbled across this blog, maybe you'll find something useful too.
There are many scholars (for example David Moore, Edward Tuftes, Ian Ayres) who have done significant work to make statistics more accessible and more useful to a broad audience. I don't expect this small blog to ever equal their contributions but maybe it will turn a few people on to the power and importance of data.
Subscribe to:
Posts (Atom)