With both the "great resignation" and inflation in the news, I decided that it was time to look at the US minimum wage. I've put my findings in a single chart.
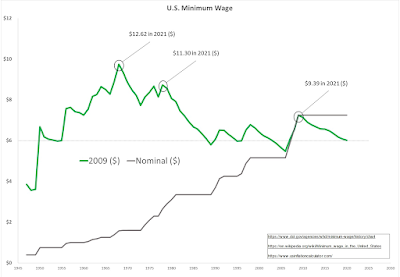
Since the minimum wage was last raised in 2009, I converted all values to 2009 dollars. To my eye, a couple of things stand out.
- After stabilizing around 1950, there appears to be a floor near $6.00 (2009 value) for the minimum wage. The current wage is $6.01 in 2009 dollars.
- The highest minimum wage was in 1968 with the second highest in 1978. There was significant inflation during this time period.
Since we are approaching the historical floor, I think that one can make a fairly strong argument in favor of increasing the federal minimum wage.
The bigger question is how far it should be raised. The data gives us three points to consider.
- If we wish to match the highest historical value, then 1968's wage translates to $12.62 today.
- If the highest historical value seems too high, then we could aim for the second highest. The 1978 wage would give us $11.30 today.
- If we simply wanted to match the last increase, then 2009's $7.25 would be $9.39 today.
Combining those, one could reasonably argue for a new minimum wage anywhere between $9.40 and $12.65.
Disclaimers: I am well aware that many historical "minimum wage" jobs now pay more than minimum wage. I will let others argue about whether that is due to labor supply/demand or political pressure. My analysis is based on nothing more than the data. It is not an analysis of human value.
However, I'll make one political statement. It would be a great bipartisan move to increase the minimum wage. Sure, the argument about the exact figure could get ugly, but our political leaders could also decide to act like grown-ups, look at the data, find a compromise number, and show the country that they can work together. It could be done quickly.
Sources:
https://www.dol.gov/agencies/whd/minimum-wage/history/chart
https://en.wikipedia.org/wiki/Minimum_wage_in_the_United_States
https://www.usinflationcalculator.com/