Search This Blog

Thursday, October 20, 2022

Measures of central tendency aren't enough...


Here's another example of why "averages" are not enough.

This article claims that U.S. car shoppers want "too much car" because they want a 300-mile range for EVs.

"Yet there is a glaring disconnect between what American drivers want and what they actually need: Some 95% of U.S. car trips are 30 miles or less."

That statement doesn't address the issue at all because it doesn't address the length of the other 5% of trips. It's focused on averages instead of variability.

I might fit this pattern. Most of my trips, probably close to 95%, are less than 40 or 50 miles. However, about every two months, I head out of town to visit relatives who are between 450 and 700 miles away.

If EVs are only short-range, then my options are:

  1. Stop frequently to recharge on my long trips.
  2. Rent a gas vehicle every time I leave town.
  3. Own two vehicles: an EV for around town and a gas vehicle for out of town.
  4. Don't buy an EV
So far, I've selected option #4. For most one-car households, that's a reasonable choice that has nothing to do with wanting "too much car". 

However, my wife and I have considered #3 because we already are a two-car family. If we could find an EV that wasn't too expensive and had sufficient legroom (I'm over 6' tall), then we might buy one. 

Thursday, May 5, 2022

Sex! Drugs! (or just another correlation/causality example)

How did I not hear about this sooner? Maybe I just wasn't paying attention, but one would think that this would have been headline news.

Five months ago, research came out showing an association between Viagra (sildenafil) and Alzheimer's: "sildenafil users were 69% less likely to develop Alzheimer’s over a six-year period than non-users". 

The full paper is behind a paywall, but you can read the abstract. The most important line is this: 

"The association between sildenafil use and decreased incidence of AD does not establish causality, which will require a randomized controlled trial."

As much as some want to giggle about Viagra, this is an interesting statistical problem. Think about how one would structure a controlled trial.

Remember - sildenafil is prescribed for two reasons:

  • Sex (erectile dysfunction)
  • High blood pressure (pulmonary arterial hypertension)
Could we even do a randomized controlled trial with men in these groups? That's tricky. Even with informed consent, is it ethical to randomly withhold medical treatment known to help with either of these conditions? 

A ethical trial would require a group of men old enough to be at risk for Alzheimer's and with neither medical condition. They would volunteer to be randomly assigned to sildenafil or a placebo. In a double-blind study, neither they nor their direct researchers would know who was receiving the real drug. 

It's Viagra. How long do you think it would take before the men figured out which group they were in?

This leaves us with problems.
  1. It would be unethical to do a trial with men who have a medical need for sildenafil.
  2. It would be nearly impossible to maintain double-blind status for any length of time.
I don't have a solution but I have a suggestion for where research could start. Since sildenafil is prescribed for two different conditions, the existing data should be separated by medical condition. Then the Alzheimer's incidence could be compared between those two conditions.**

Suppose that those treated for erectile dysfunction had lower incidence of Alzheimer's than those treated for hypertension. That could imply that it's not the sildenafil itself, but the increased frequency of sex that helps prevent Alzheimer's. Many men would cheer for that.

Then suppose the opposite. What if the data showed that those treated for hypertension had lower incidence than those treated for erectile dysfunction. Would that imply that too much sex could increase the risk of Alzheimer's? Now most men wouldn't cheer as much.

What if there's no difference in Alzheimer's incidence? That's evidence in favor of sildenafil causing decreased Alzheimer's, but it's still far from proof. Maybe sildenafil allows both groups to exercise more. Maybe it's ... just about anything. 

This is why medical research is hard. There are usually ethical issues and it's difficult to maintain double-blind status for any treatment that has well-known side effects.

-------
**It's possible that this separation was done in the study. Since it's behind a paywall, I can't check but the abstract doesn't mention it.

Friday, December 17, 2021

Looking at Minimum Wage

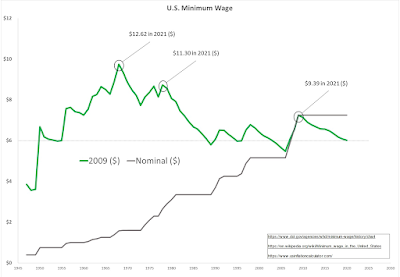
With both the "great resignation" and inflation in the news, I decided that it was time to look at the US minimum wage. I've put my findings in a single chart.


Since the minimum wage was last raised in 2009, I converted all values to 2009 dollars. To my eye, a couple of things stand out.
  • After stabilizing around 1950, there appears to be a floor near $6.00 (2009 value) for the minimum wage. The current wage is $6.01 in 2009 dollars.
  • The highest minimum wage was in 1968 with the second highest in 1978. There was significant inflation during this time period.
Since we are approaching the historical floor, I think that one can make a fairly strong argument in favor of increasing the federal minimum wage. 

The bigger question is how far it should be raised. The data gives us three points to consider.
  • If we wish to match the highest historical value, then 1968's wage translates to $12.62 today.
  • If the highest historical value seems too high, then we could aim for the second highest. The 1978 wage would give us $11.30 today.
  • If we simply wanted to match the last increase, then 2009's $7.25 would be $9.39 today.
Combining those, one could reasonably argue for a new minimum wage anywhere between $9.40 and $12.65.

Disclaimers: I am well aware that many historical "minimum wage" jobs now pay more than minimum wage. I will let others argue about whether that is due to labor supply/demand or political pressure. My analysis is based on nothing more than the data. It is not an analysis of human value.  

However, I'll make one political statement. It would be a great bipartisan move to increase the minimum wage. Sure, the argument about the exact figure could get ugly, but our political leaders could also decide to act like grown-ups, look at the data, find a compromise number, and show the country that they can work together. It could be done quickly. 

Sources:

https://www.dol.gov/agencies/whd/minimum-wage/history/chart
https://en.wikipedia.org/wiki/Minimum_wage_in_the_United_States
https://www.usinflationcalculator.com/

Thursday, December 16, 2021

"Great Resignation" or "Great Retirement"?

Over 10 years ago, I wrote Will the Baby Boomers Ever Retire? in response to an article predicting tremendous retirements among financial professionals in "three to five years".

Here is a quote from early in post:

"Today is March 17th, 2011. The funny thing is, I've been hearing about mass retirements in the next "three to five years" since the 1990s."

My overall conclusion/prediction was: 

"So what's going to happen? Will there be a "tremendous number" of retirements in "three to five years"? I don't know for sure, but I don't think so. Of course the Boomers will all eventually retire or die but I think they'll go by attrition rather than en masse. Most of the Boomers I know simply do not have the resources to retire any time soon. Some will be forced to retire when their health fails. Others might get a nice inheritance along the way and decide that they finally have the resources to retire. Others will work well into their 60's and even their 70's either because they have to or they just plain want to."

For several years, I think that my prediction held up well. 

Then Covid-19 came.

We're hearing a lot about the "Great Resignation" and the depleting labor force. However, this article makes the argument that it's not a general abandonment of the labor force. Instead, it's driven by retirement

"Last month, there were 3.6 million more Americans who had left the labor force ... compared with November 2019. ... Older Americans, age 55 and up, accounted for whopping 90% of that increase."

There is disagreement on exactly where the line is between the Boomers and GenX, but most demographers put it somewhere between 1964 and 1966. In other words, "age 55 and up" pretty much catches the tail end of the Boomers.

After 25 years of "three to five year" predictions, it looks like the Boomer are finally retiring.


Thursday, October 21, 2021

Data Analytics vs Confirmation Bias

I've often said that corporate culture is the largest impediment to the effective use of data. The problem is simple. Organizations say that they are "data driven" but in practice, people embrace data that supports their prior conclusions and reject data that doesn't match.

We call this confirmation bias.

This morning, I was reading Peggy Noonan's column in the 10/7/2021 edition of the Wall Street Journal and came across this:

"I’m not a huge respecter of polls (only snapshots, not a measure of greatness or consequence) but when polls put numbers on what you’re sensing you pay attention."

Wow. I'd like to call it a "textbook" example of confirmation bias but I think it's beyond that. Few people are this self-aware regarding their own confirmation bias and, of those who realize it, even fewer will openly admit it.

I'm a fan of Noonan's writing. I applaud her honesty but I'm disappointed by her lack of trust in data.

As a long-term colleague and co-author often says - you have to be willing to let the data surprise you.


Wednesday, October 20, 2021

Survivorship Bias and Covid-19

One would think that a global pandemic that caused many of us to spend much more time at home would have resulted in great blogging productivity but that didn't happen. I haven't written anything in over a year. Instead during that time I:

  • Took over the Chair's role in an academic department that lost 25% of its faculty less than a month before the school year started.
  • Turned every class that I teach into either an online course or a hybrid (and got much better at quickly creating and editing videos),
  • Published a co-authored paper on interdisciplinary teaching, and
  • Moved over 400 miles to take a position with a new employer (go Wildcats!).
Oh well. Life gets busy. But some recent discussion I've had regarding covid-19 inspired me to create another post. Yes, another covid-19 post.

Ever since vaccines became available, there's been some debate on the role of natural immunity but there's been little actual data. For example, here's an excerpt from an October 19 Fast Company article.

-------------------------
One example: August 15, 2021 data showed cases at their peak for the period of time this tool’s data covers. On that day there were:
  • Unvaccinated: 736.72 infections per 100,000 people
  • Janssen-vaccinated: 171.92 infections per 100,000 people
  • Pfizer-vaccinated: 135.64 infections per 100,000 people
  • Moderna-vaccinated: 86.28 infections per 100,000 people
-------------------

I'm in the Janssen-vaccinated group, but I also had covid a couple of months before I was able to get the vaccine. What does "171.92 infections per 10,000 people" tell me about my risk of breakthrough infection? It's unlikely that the risk is the same for (Janssen-vaccinated/Recovered) and (Janssen-vaccinated/Never Infected). By ignoring the infected/recovered variable, these numbers aren't very useful.

Finally, in late August, a study came out of Israel claiming that natural immunity is even stronger than vaccine immunity. There is current debate on that study, but for the moment, let's assume that its findings are correct.

So what? Does this mean that you should try to get covid instead of a vaccine?

Statistically speaking - No.

Using this study to promote infection instead of vaccination commits a serious logical fallacy: Survivorship Bias. When you attempt to generalize from a dataset you need to think carefully about the population represented by your data and the population to which you wish to generalize. Survivorship bias occurs when the entities (people, airplanes, etc.) in your data set are systematically different from those that were eliminated from the data.

In the case of natural immunity, the data includes only those who quite literally survived the disease and excludes those killed by it. It should be no surprise that their current immunity is stronger than the immunity of those who died. It's entirely possible that survivors had stronger immune systems in the first place.

Therefore, the Israeli study cannot be used to recommend natural immunity over vaccination for the general population. 

So what can we say about the general population? 

If you have never had covid-19 and you are currently unvaccinated, then you have a choice:
  1. Get vaccinated and face the side-effect risks.
  2. Take your chances on getting covid and face the disease risks. 
For both of those decisions, the data is out there. Thankfully, the overall hospitalization/death rates of covid-19 are small. Still, the vaccine side-effects risks for most people are even smaller. In some demographic groups, the side-effects risks are much, much smaller than disease risks. 

Based on the data that I've seen, I recommend #1, but I respect your right to look at the same data and make a different decision based on your own medical situation.

 If you have recovered from covid-19 and you are currently unvaccinated, then you have a choice:
  1. Get vaccinated and face the side-effect risks.
  2. Take your chances on natural immunity.
This is a more difficult decision. The vaccine side-effect risks (#1) are still small. In the absence of data, I suspect that they're even smaller for the infected-recovered than for the never-infected but I think we have to assume that some risk is still there. On the other hand, we aren't sure what your reinfection risk is under #1 or #2. Either way, it's not zero.

Knowing what I know now, I would still choose vaccination. I consider the side-effect risks small and it's likely that the combination of my recovery and the vaccine is giving me even stronger protection now.

However, I see no reason to require vaccination for those who are infected-recovered. Without much stronger evidence to the contrary, they should be treated as if they were vaccinated**. 

Next, we'll have the booster issue. I can't draw any conclusion on boosters because I haven't seen any data the takes into account the difference between Vaccinated/Recovered and Vaccinated/Never-infected. This problem will not go away as long as studies and public policy continue to ignore natural immunity.

Summary: You should not seek out covid-19 in order to get natural immunity, but if you already survived covid-19 (thankfully) then your natural immunity needs to be considered.

==================
**In hindsight, I should have been denied a vaccine in March 2021. Vaccines were in short supply and many people wanted them. Those of us who already had covid should have been pushed to the back of the line. It wouldn't have hurt us to wait until June or July.

Thursday, August 27, 2020

Millennials: Yes, this was predicted.

I guess I'm developing a habit of an annual post about millennials. My first was in October 2018 and my second was September 2019

In the first post, I talked about my personal experience with different generations of students and linked to an article about millennials. In the second, I didn't say as much and linked to another article.

The overall message was - millennials aren't wildly different than prior generations.

Well here's another article about millennials. Since it's in the Wall Street Journal, it might be behind a paywall. So here's the main point: millennials - who were supposedly going to reject traditional family housing and completely change urban living - are driving the 2020 housing market.

Yes, this was predicted. The millennials are, on average, marrying later and having kids later but they're still marrying, having kids, and buying houses.  


Monday, August 17, 2020

Gaiters - Are they bad or did the news jump the gun (again).

Yes, I suppose that this is another COVID-19 post but I haven't written about COVID since April and March. Also - one could argue that this post isn't really about COVID. It's really about press coverage of emerging research (maybe any research) and COVID just happens to be the context.

You've probably seen the headlines or heard the news that the neck gaiters people have been wearing as face masks might not be working. Six days ago the headline was pretty scary: "Wearing a neck gaiter may be worse than no mask at all, researchers find".

OK, they did say "may" which could imply some uncertainty, but the coverage that I saw was pretty negative on gaiters. In fact, my employer has banned them based on these reports.

Four days ago, the headline was a little less scary: "Some neck gaiters may be worse than not wearing a mask at all, study shows". Now it says both "may" and "some".

Three days ago, the headline shifted again: "The results of this viral mask study found gaiters weren't effective - but it that true?" That's a very different headline and the article includes a quote from one of the researchers (Brian Labus):

“People have really gone overboard with their interpretation of this study. The goal of the study was not actually to evaluate masks” 

What??? They weren't even trying to evaluate masks? You wouldn't know it from the headlines but they were trying to develop a low-cost method that could be used to evaluate masks. 

In fairness, I should point out that all three articles include a link to the actual research report. Unfortunately, when major news outlets report on research, very few readers click through to the actual research (did you click my link?). Instead, people count on the news story to accurately summarize the research. In this case, the news blew it and focused on a peripheral issue.

In my experience, it's not unusual for news reports about research to do a poor job of representing the research. Sometimes it's intentional but often it's just sloppy reporting.

That said, there was a peripheral finding with a small sample size for a particular gaiter. That's far from conclusive but it should be enough to raise concerns and encourage further research on gaiters. I hope that research happens soon and gets better reporting.

Oh, about that sample size I mentioned in the previous paragraph? I could comment on it, but I won't. You should click through to the actual research study and see for yourself. 

Saturday, April 25, 2020

Wow. How did so many of us miss this?

I've tried to stick to my plan to write only one post about COVID-19 but it's been hard because there are so many data issues to talk about. As an aside - I think that StatNews is doing a pretty good job covering things.

But then I ran across this Wired story by Ferris Jabr. You should read it yourself but I'll be nice and quote the main point:

"Both newspapers and scientific journals frequently state three facts about the Spanish flu: it infected 500 million people (nearly one-third of the world population at the time); it killed between 50 and 100 million people; and it had a case fatality rate of 2.5 percent. This is not mathematically possible. Once a pandemic is over and all the numbers are tallied, its case fatality rate is simply the total number of deaths divided by the total number of recorded cases. Each country and city will have its own CFR, but it’s also common to calculate a global average. If the Spanish flu infected 500 million and killed 50 to 100 million, the global CFR was 10 to 20 percent. If the fatality rate was in fact 2.5 percent, and if 500 million were infected, then the death toll was 12.5 million. There were 1.8 billion people in 1918. To make 50 million deaths compatible with a 2.5 percent CFR would require at least two billion infections—more than the number of people that existed at the time."

Wow. How did we all miss this? Are we so innumerate that we didn't see 500 million and 50 million and immediately say "Hey, that's 10% not 2.5%"? Shame on us.

Beyond pointing out that none of us are paying careful attention, Jabr digs into the history behind these numbers and uncovers a lot of uncertainty about the Spanish Flu.

So here's where we stand.

  1. COVID-19. My original post is still correct. The data would matter greatly if we had it. But we don't. It's getting better but it's still inconsistent and unclear and we're still facing extensive uncertainly. 
  2. Spanish flu. This data would also matter greatly if we had it. But we don't have good data and, at this point in history, we never will.
The take-away? We need to get more comfortable with margins of error and ranges of estimates. Data literacy should emphasize the need to look beyond simple point estimates.

Along those lines, I've just started a simulation unit in one of my classes. Simulation is a great tool for dealing with high levels of uncertainty. If you want to see my opening lesson, it's right here:

Tuesday, April 14, 2020

Interesting Shifts in Consumer Spending

From one of my favorite blogs: https://flowingdata.com/2020/04/12/change-in-consumer-spending-since-the-virus/

To me, the most fascinating aspect of this graph is that "groceries" initially jumped nearly 50% but now appears to be trending back to pre-stay-at-home levels while all other categories continue to decrease.

Much of the drop may be due to the sudden increase in unemployment but we can hope that some of it is due to people simply not having opportunities to spend. If people are saving money now, then maybe they'll splurge when this is over and help revive the economy.

Sunday, April 12, 2020

If it saves just one life...

How many times have you heard someone say "If it saves just one life, then it's worth it"?

That's one of my pet peeves because it's blatantly wrong. We will not do whatever it takes to "save just one life".

Consider auto accidents. Just under 40,000 people are killed each year in traffic accidents in the US. We could eliminate nearly all of those with just two regulations:
  • Speed Limit: A strictly enforced national speed limit of 10 miles per hour on all roads of all types.
  • Safety Equipment: Require all passengers and drivers to use fire suits, helmets, and NASCAR style five-point safety harnesses.
Of course, there's no way that we're going to do that. The cost is too high. It would save tens of thousands of lives but we won't do it.

Maybe that's not enough lives or maybe the rules would be too hard to enforce. So here's another idea.

About 5,000 pedestrians and 800~900 cyclists are killed by motorized vehicles each year. Instead of those two suggested rules, we should simply outlaw motorized vehicles completely. Then we'd save about 45,000 lives combined from traffic accidents, vehicle-pedestrian accidents, and vehicle-cyclist accidents.

By banning all motorized vehicles, we'd also stop over 500 boating deaths, several hundred ATV deaths per year, and all plane crash deaths.

Now we're talking WAY more than "just one life" so surely it's worth it. Isn't it? No, it's not. If someone actually attempted to outlaw motorized vehicles, they wouldn't get very far.

Maybe people who say "it's worth it" mean "it's worth it, as long as you don't mess with our transportation system".

OK. Let's explore that.

Between 2012 and 2016, there were over 176,000 home structure fires started by cooking activities. This led to over 5000 fire injuries and 530 deaths. That's over 100 deaths per year caused by cooking at home. Therefore, we should outlaw cooking at home. It would save over 100 lives per year. That's more than just one life so it's worth it.

We also need to outlaw sports. Obviously, boxing is dangerous with over 500 deaths in the ring since 1884. Football has to go too. There's been one only death on the field in the NFL but there are several every year in youth, high school, and college football.    Several.    Every single year.

We can't switch over to soccer either. Or hockey. Or Basketball. Fatality rates in some of these sports aren't high but they're not zero and "if it saves just one life, then it's worth it". All sports would need to be banned.

Any one of us could easily come up with more examples, but I think you get my point. There are limits to what we will do, pay, give up, etc. to save lives. There always has been and always will be.

So what do people mean when they say "if it saves just one life, then it's worth it"? In some cases, they're probably not thinking rationally. It's a statement made in an emotionally stressful moment and, if they thought about it, they wouldn't say it.

However, I think it's more often an attempt to manipulate. When they say "if it saves just one life..." what they're actually saying is "this rule/policy/expenditure is really important to me and I don't want anyone to argue with me or do any sort of cost/benefit analysis". 

It's really just an attempt to cut off discussion and ignore the data. When that happens, I call them on it because - data matters.

Friday, March 20, 2020

COVID-19 Data would matter...


... if we had decent data and knew what to do with it.

I'm not an epidemiologist so I'm not going to write a lot about COVID-19 on this blog but there are some interesting data lessons.

I'm also going to post only one link (edit: see the end of this post). There are many articles about COVID-19 that I could reference, but I'm not going to. Instead, I'm going to give you a single data source (https://coronavirus-realtime.com/) and comment on "things we're hearing about" instead of citing specific sources.


Lesson 1: Simple calculations don't work if you're using the wrong data.

As of this morning, the site above shows 247,400 total cases and 10,067 total deaths worldwide. For the moment, let's assume that both of those numbers are accurate. What's the fatality rate?

The simple calculation that many people are doing is 10,067/247,400 = 4.1%

The arithmetic is correct, but the number doesn't answer the question at all. Most of the 247,400 cases are still in-process. We don't know how they will end.

To answer the fatality rate, we need to look at cases that are resolved. That restricts us to cases that are recovered (86,037) or deceased (10,067). That's 96,104 cases and, tragically, 10.5% of them had ended in death.

But that's still not the fatality rate...

Lesson 2: Bad data can be worse the no data

Let's look at all three of those numbers:
  • 247,400 total cases
  • 86,037 recovered
  • 10,067 deaths
None of them are correct. NONE. Let's take them in order.

First, Total Cases: There have been multiple reports of people being denied tests because they weren't ill enough or they didn't show the right symptoms. However, we've also been told that many who get COVID-19 will show mild or no symptoms. I've read claims that more than half of those who get COVID-19 will be completely asymptomatic. 

Therefore, the total number of cases could be double the reported number. Tests are becoming more widely available, but they're still being reserved for people who actually have symptoms. We would need to test large samples of asymptomatic people in order to properly estimate total cases. This might eventually happen for research purposes, but it's not going to happen in the midst of the crisis.

The total cases number also has interpretive problems. As of yesterday, my county had four confirmed cases. One was a woman in her 50's with no known travel or contact with infected people (what they're calling "community spread"). The other three cases were all in one family that traveled together. To eventually compute fatality rates, those are four separate cases. In terms of contagion, I would say that they are just two cases. I think that's an important distinction but I doubt that we'll ever have solid data that allows us that distinction. 

Second, Recovered: The inaccuracy of total cases makes this number wrong too. If we never knew that you had it, then we'll never count you as recovered. 

But it's worse than that. One news story said that patients weren't cleared until they tested negative on two tests administered 24 hours apart. Remember the shortage of tests? How many people are currently recovered but not officially recovered? 

The source above shows zero recovered cases in either California or Washington. I've been watching this site for more than two weeks and not everyone who was active two weeks ago has died. By now they should be recovered so I don't know why there are no reported recoveries. It could be the issue in the prior paragraph or something else.

Third, Deaths: As with recoveries, the total cases number makes this number wrong too. If we never knew that you had COVID-19, then we won't attribute your death to it. Even if we know that you had COVID-19, death can be complicated. 

My 90-year old mother passed away last year 10 days after a bad fall. Did she die from "falling" or from "complications of a fall" or ...? Several months earlier, she nearly died from sepsis. But the sepsis was the result of an untreated urinary tract infection. The recurring urinary tract infections were a result of other medical complications. If she had died during the sepsis incident, what would the real cause be?

Consider someone who is completely healthy. Then they test positive for COVID-19 and they die fairly soon. It would be pretty clear that COVID-19 killed them. On the other hand, if someone has a myriad of health problems and COVID-19 becomes the tipping point, then maybe COVID-19 "sort-of" killed them.

When I say that "bad data can be worse than no data", it's not because the data shouldn't be collected. It's because people don't understand it, they make simple calculations with it, and then they push for public policy and private decisions based on incorrect numbers. However, we do want the data...

Lesson 3: Keep collecting the data and keep a level of skepticism

There are other issues that could be raised with all of these numbers. I touched on age and health but didn't dive deeply into those. I've also ignored differing data methods in different countries.

Still, we'll eventually have better data. It will never be perfect (no useful data is) but it will get better. I'm a big fan of statistical literacy and public access to raw data but "armchair" statisticians need to be careful about their own number crunching. This is a situation where you should listen to the experts but focus on
a) admitted uncertainties in their calculations - like margins of error - and 
b) disagreements among them.

Admitted uncertainties and disagreements from the experts will give you a good idea of how uncertain their conclusions are.

------------------------------------------------------------------
NOTE: The day after I wrote this, I ran across a great article on the data aspect of COVID-19 so I'm posting it here and not re-writing my post.
------------------------------------------------------------------

Monday, October 7, 2019

Puppies, Mandopop, and Causality

Here's the best puppy video that I've ever seen on YouTube. It's only 9 seconds. Trust me, it's worth watching.


It's even better looped. Try it with YouTube's loop feature. It's just gets better and better.

After I watched it a few times, I wondered what that catchy song was. It didn't take long for Shazam to identify it, but I struggled a bit getting the Chinese characters into a search field. I still don't know the name of the song, but it's recorded by the Mandopop* group By2.


Here are some comments for the song's video.


There's a clear causal claim here: the popularity of the puppy video caused the popularity of the song video. 

That sounds reasonable, but...    ... is it true?

Think about why the puppy video is so great. Sure, the rear dog's face plant into the snow is funny and the can-do spirit he shows by quickly jumping back up is inspirational. But I think it's the way the song perfectly syncs to the front dog's bounces that makes the video great.

At first, you think that the dog syncs to the song but that's not true. The song was added later. The dog does not sync to the song. The song syncs to the dog. That's an important distinction.

Compare the first version of the puppies to this one. It's longer, about a minute, but you need to watch only the first 10 to 20 seconds.


It's the same puppies doing the same thing but it's not nearly as cute. 

That should make you think about the causal claim in the music video's comments. Maybe the puppy video is not the cause of the song's popularity. Maybe they have it backwards. Maybe, just maybe, the song is the cause of the puppy video's popularity. 

Then again, maybe the comments are right. Either way, you can't confirm a causal relationship from a simple observational relationship**.

Unjustified causal conclusions are a common statistical error. When two variables show a relationship and "it makes sense" that A causes B***, we often jump to a causal conclusion without question. The jump to a causal conclusion is so common that I think we'd benefit from training ourselves to think the other way. Our first reaction to a statistical relationship should be to question any causal relationship. 

--------
* Thanks to my colleague Chao Zheng for clarifying that the song is Mandarin instead of Cantonese.

** To be clear. I don't think the presence of two different sound tracks on the same puppy video is sufficient to claim there's an experiment. This is still observational. However, it's a good thought exercise to think about how you would make it an experiment.

*** Or, worse yet, we already believed the causal relationship and we were just looking for data to prove ourselves right.

Thursday, September 5, 2019

Qualitative Data is Data Too (Part 3)

I laid out the value of qualitative data in Part 1 and and gave an example in Part 2. In this part, I've got my own analysis. Here's a series of qualitative data points.

Once upon a time, Council Bluffs Iowa was a major stopping point for westward travelers due to the presence of a steam powered boat to ferry wagons and livestock over the Missouri River. Then someone decided that a transcontinental railroad would be a good idea. Wagon trains were fine, but railroads would be faster and more efficient for people, products, and livestock.

The big question: where would it go?

Several broad routes were considered and a "central" route was selected. Within the central route, an eastern starting point had to be selected. As POTUS, Abraham Lincoln would make the decision.

Just imagine the economic loss for Council Bluffs if Kansas City Missouri were selected as the starting point. Council Bluffs would have turned into a ghost town.

As luck would have it, one of the investors had previously employed Lincoln as an attorney and this investor wanted Council Bluffs selected. There's no way to be certain, but it would be reasonable to conclude that his connection to Lincoln influenced the decision. Council Bluffs was selected and by the 1930's its status as a wagon train stopping point was replaced by its status as the 5th largest rail center in the US.

The invention of the automobile again changed the nature of transportation and Route 66 was established in 1926. When completed it ran from Chicago to Santa Monica and became one of the most famous highways in US history. By 1930, trucks rivaled rail for dominance in shipping.

Route 66 was a financial boon for towns and businesses along the route but, like many highways, its path wasn't static.

In Atlanta Illinois, the original route ran right through town and businesses thrived. Twenty years later, a bypass was built and businesses died.

In New Mexico, an angry Governor used his lame-duck power to move Route 66 and bypass the state capital: "In 1924, Democrat Arthur Thomas Hannett was unexpectedly elected for a single term (1925–1927) as governor, only to be defeated with various dirty tricks in the next election. Blaming the Republican establishment in Santa Fe for his defeat, Hannett used the lame duck remainder of his term to force through a sixty-nine mile cutoff from Santa Rosa directly to Albuquerque, bypassing Santa Fe entirely."

These are just a few of many examples of Route 66 changes over the years. Most were not as blatantly political as in New Mexico, but each change still had politics in the background. Whether they were elected or appointed, someone or some group made the decision. 

Just as rail usurped wagons and highways usurped rail, interstates began usurping highways in the 1950s. Portions of these interstates (I55, I44, I40) follow Route 66 very closely but most of Route 66 was bypassed. Much of the current Route 66 nostalgia focuses on the economic impact of the interstates and how they created a new generation of ghost towns. 

This might not look like "data". Maybe you think it's just a story, a narrative of changing modes of transportation (admittedly a very abbreviated narrative). However, I would argue that there's a discernible pattern here and that we can derive insights from that pattern.

1) Things change. Downtown dime stores (Kresge's, Ben Franklin, Grants) had a little of everything and threatened their neighboring, specialized stores. Then Kresge's morphed in big-box discount K-Mart and threatened all of downtown. Walmart came along and knocked K-mart off the top of the hill. The internet came along and Amazon knocked Walmart off the top. 

2) When things change, politics matters. This is actually the main point, but I used #1 to emphasize the inevitability of change. Changes in transportation required political decisions about routes and right-of-ways. Changes in retail required political decisions about zoning, building codes, and taxation. If you plan to be in business, then you need to understand politics. Study politics. Study political economy. Read Travels of a T-shirt and pay attention to the policy and regulatory decisions made by a myriad of political bodies. 

3) Nostalgia is selective. This is a minor point, but I still find it interesting. Route 66 is "hot" at the moment. Perhaps it's because of Disney's Cars or maybe it's relative to age of the Baby Boomers. Either way, there are books, blogs, articles, etc. about the sad loss of prosperity on Route 66. I don't see this level of concern over the ghost towns created when wagon trains disappeared. More recently, Lena Wisconsin's downtown was bypassed by reconstruction of Highway 141. Maybe the locals talk about the impact on Lena's downtown, but there's no national discussion that I've ever heard about.

Sources:
  • https://en.wikipedia.org/wiki/U.S._Route_66
  • https://www.national66.org/history-of-route-66/
  • http://library.nau.edu/speccoll/exhibits/route66/paths.html
  • https://en.wikipedia.org/wiki/U.S._Route_66_in_New_Mexico
  • https://www.route66news.com/2007/03/19/road-to-albuquerque-was-a-joke/
  • Personal experience gathered on a recent Route 66 vacation


Millenials Again - They Still Aren't All That Different

Last year, I wrote a post about millennials, demographics, and the risk of making overly broad generalizations.

Here's another report telling us that millennials aren't all that different than previous generations. They might be hitting some "life moments" later, but they still want the same things that their parents wanted.

Friday, August 23, 2019

Qualitative Data is Data Too (Part 2)

In Part 1, I contrasted traditional data analysis and qualitative analysis. In this part, I tell a story that combines them.

Unfortunately, I don't have a source for the story. At one point, I thought I read it in the work of Russ Ackoff but I haven't been able to find it in his writing. Then I thought it might be from Gene Woolsey. I was fortunate enough to spend some time on the phone with Dr. Woolsey toward the end of his career. He agreed that the story sounded like something that either he or Ackoff would have written but it wasn't his and he didn't recognize it from Ackoff's work. Therefore, even though I know that the story exists, I can't cite it and it remains apocryphal.

Since I can't find the source, I can't double-check the details. If anyone can confirm a source, please let me know.

Here's the story...

Back around 1970, a quantitative analyst was hired as a consultant by a Fortune 500 firm in Los Angeles. They were considering moving their operation out of the city to the suburbs and they wanted him to evaluate the long-range cost/savings of expanding where they were versus relocating. The consultant gathered the necessary data, did the analysis, and concluded that there would be significant savings if the company moved. He reported his results, got paid for his time, and went on his way. Nothing changed at the company.

About 18 months later, he ran into the CEO who had hired him. He brought up the project and apologized that his work hadn't been useful. The CEO seemed surprised and assured him that his analysis had been crucial to their decision.

"But you're not moving" the consultant said.

"No, we're not" admitted the CEO. "We wanted to stay in the city. We thought it was better for our employees and we believed that we had a positive impact on our neighborhood. Our corporate mission seemed to fit with the city location. There was a lot of pressure to move and save money but we didn't know what the savings would be or, conversely, what the cost would be to stay put. Your analysis made the numbers clear and we decided that would afford to not move."

The moral of the story? The analyst did his job with a traditional quantitative analysis. The company made their decision on a combination of quantitative and qualitative factors. On the numbers alone, one could argue that the company reached the wrong conclusion. On the qualitative analysis, it wasn't clearly a right or wrong conclusion but it was a decision that the executives and the board were comfortable with.

In Part 3, I'll give an example of my own qualitative analysis. By necessity, my conclusions will be "fuzzy" and you might disagree with them but you should still be able to follow the logic connecting my observations and conclusions.


Wednesday, August 14, 2019

Qualitative Data is Data Too (Part 1)

To data professionals, "data" implies some sort of structure with defined records and variables. In this context, quantitative variables are numbers (such as price, income, age) and qualitative variables are non-numbers (color, country, gender, payment method). Depending on the lingo in your particular world, qualitative data could also be called nominal data or categorical data but it's still structured data.

However, some fields use the term "qualitative data" differently. Their text or observations aren't easily codified into records and variables but they still examine large segments of data to discern patterns and themes. Philosophers might read Plato, Hobbes, Smith, and Marx to generate theories and find text passages to support, or refute, those theories.

Modern technology can be used to bridge these approaches (i.e. the digital humanities). There are tools available to process online comments or customer reviews and determine how many are "positive" but some questions and some data simply don't lend themselves to any sort of structured data methods.

Let's use the Bible as an example. One could ask "How many times is the word money in the Bible?" Since the Bible wasn't written in English, we'd first have to agree on which translation we're going to use. Then it wouldn't be difficult to process every single word and count the number of times "money" occurs. It's no surprise that this has already been done. I suppose it's interesting that the King James version uses "money" 140 times, but I'm not sure that this mini-fact is particularly useful.

There are other words for "money". The Bible might mention payment, wages, debt, inheritance, silver, gold, ...  This source tells us that there are over 2300 verses in Bible that mention "money, wealth, or possessions".

But are "possessions" and "money" really the same thing? This analysis requires another step. As before, we'd have to agree on which translation to use but we'd also have to agree on a list of synonyms for "money". We might even come up with an ordinal scale for whether a word is a true equivalent or simply related. Then, as with the previous question, a program could process every word in the text and count how many times "money" and each synonym occurred.

In both of these examples, it's possible to process the Biblical text as more or less traditional data but the results aren't all that useful.

A much more interesting question is "What does the Bible teach about money?" Many have attempted to answer that question, but none of them were able to do so with traditional statistical or data analysis tools.

Data professionals often aren't comfortable with this type of qualitative analysis. It's too fuzzy or too touchy-feely. However, it's likely that the people data professionals report to are using all kinds of "fuzzy" analysis so it might be wise to study some fields where qualitative analysis is commonly used.

In Part 2, I'll tell a story of qualitative analysis and decision making. In Part 3, I'll do my own qualitative analysis.


Wednesday, July 31, 2019

A new article

Twenty years ago, I wrote about the role of spreadsheet modeling in Operations Research/Management Science (OR/MS) education. It got a fair amount of attention. This month, I'm taking on another potential controversy: the interplay of "analytics" and "OR/MS".

Tuesday, March 26, 2019

Small Data (really small) and Expectation Management

Years ago, my wife and I went to see the movie Romancing the Stone. We were visiting a small town and it was the only movie playing. It was new in theaters and we didn't know anything about it.

We loved it. We told lots of people how good it was.

We loved it so much that we went to see it again about a month later. It was still good, but it wasn't great. We realized that we had zero expectations the first time - we were just looking for something to do - and high expectations the second time.

Years later, our friends were raving about My Big Fat Greek Wedding. They insisted that we see it. Really insisted. We were told that we needed to see it.

We finally went and it was a disappointment. It wasn't a bad movie, but no movie could live up the hyped reviews we heard.

Over the years we've referred back to those movies when we find ourselves reacting differently than expected. We recently went to a restaurant that someone close to us insisted that we try. It was disappointing. Then one of us said "I guess this was a Big Fat Greek Wedding instead of Romancing The Stone". It was actually a nice restaurant but it couldn't possibly live up to the expectations we were given

In related news, I just finished reading The Undoing Project by Michael Lewis. I learned some of this material in graduate school but, as usual, Lewis does a great job telling the story. The discoveries of Kahneman and Tversky explain our experience with the movies and the restaurant.

Small data, such as word-of-mouth reviews from a few friends, are poor statistical samples but people still give it significant weight in forming judgments. With social media, small data can get repeated and amplified so that it looks like much larger data and, again, people will give it significant weight in forming judgments.

We all want good reviews for our endeavors, but we should also want accurate reviews. What if I do good work, but my good work merely meets your expectations (or even falls slightly short). I'd rather be judged against an accurate expectation than an inflated one. However, in the world of small data where people aren't completely rational, I'm not sure how to make that happen.

Tuesday, March 12, 2019

Using Excel's Filters (Spring 2019)

I just posted a new video for my students on YouTube.